[fikira] Divergences (RSI)This script can be used with candlesticks, accompanied with " RSI + Divergences" The calculation is different than my "Divergences (Pivots)" Thank you! Pine Script® göstergesifikira tarafındanGüncellendi 1717871
Bull Bear Divergence IndicatorFor Constance Brown-like analysis with divergence signals between price and indicator (i.e. stock close / RSI divergence) Using two different lines: an indicator high line for bearish, and an indi low line for bullish divergences For your individual studies, choose your indicator and replace rsi in line 10 with it, any thing else is auto. Script bottom: optional comparison linse addable Note1: The script only shows divergences to recent pivots, not between actual pivot and one "a few pivots ago" Note2: Though reversal predictions with the example of SPLK here are quite good, in general better results are obtained with un-normalized indicators.Pine Script® göstergesidep0tyoxxx tarafından77209
ALL-IN-ONE RSI System (Cloud Divergence Stoch RSI CM WVF)This indicator combines RSI Cloud structure, original RSI divergence logic, Stochastic RSI timing, and the original CM Williams Vix Fix into a single clean framework. It is designed to identify momentum shifts, divergences, and fear-based dip zones without repainting or overfitting. Key features: RSI Cloud with customizable overbought / oversold zones Original RSI divergence logic (regular & hidden) Stochastic RSI for timing confirmation Original CM Williams Vix Fix behavior (panic detection) Optional BUY / SELL labels with filters Fully customizable colors and visibility Best used as a decision-support system, not as a standalone signal generator. Not financial advise Pine Script® göstergesiethem11 tarafından29
RSI Trending with DivergencesThis script uses the RSI and RSI divergences to mark signals where the rsi is both below/above the 50, below/above its moving average, and where the last regular or hidden divergence matches that state. The RSI is built into the indicator, so you don't need it in your bottom pane if you don't want it, I just put one there for illustrative purposes. Please note it will not print the same signal consecutively, as it is meant to show an overall direction, not the in and out fluctuations. I suggest using it in conjunction with some moving averages so you can ignore signals not in the trend. Pine Script® göstergesirisenone tarafından11127
RSI Div at Daily VWAP StDevMean Reversion indicator based on RSI Divergences at Overbought/Oversold conditions with Price above/below a Standard Deviation from Daily VWAP. Useful for intra-day trading. Signal criteria: 1. RSI is at Overbought/Oversold 2. RSI Divergence present (not hidden) 3. RSI has not reached Neutral level (i.e. 50) 4. Price has crossed above/below a Standard Deviation from Daily VWAP Config Options: - RSI length (default:14) - Divergence Lookback Period (default:14) - RSI Oversold/Overbought tresholds (default: 70/30) - RSI Reset Level (default: 55/45) - Use VWAP Std Dev (default: yes) - Standard Deviation from Daily VWAP (default: 1.51) Use with discretion.Pine Script® göstergesicrypto_rife tarafındanGüncellendi 1313 1.3 K
Yelober - Intraday ETF Dashboard# How to Read the Yelober Intraday ETF Dashboard The Intraday ETF Dashboard provides a powerful at-a-glance view of sector performance and trading opportunities. Here's how to interpret and use the information: ## Basic Dashboard Reading ### Color-Coding System - **Green values**: Positive performance or bullish signals - **Red values**: Negative performance or bearish signals - **Symbol colors**: Green = buy signal, Red = sell signal, Gray = neutral ### Example 1: Identifying Strong Sectors If you see XLF (Financials) with: - Day % showing +2.65% (green background) - Symbol in green color - RSI of 58 (not overbought) **Interpretation**: Financial sector is showing strength and momentum without being overextended. Consider long positions in top financial stocks like JPM or BAC. ### Example 2: Spotting Weakness If you see XLK (Technology) with: - Day % showing -1.20% (red background) - Week % showing -3.50% (red background) - Symbol in red color - RSI of 35 (approaching oversold) **Interpretation**: Technology sector is showing weakness across multiple timeframes. Consider avoiding tech stocks or taking short positions in names like MSFT or AAPL, but be cautious as the low RSI suggests a bounce may be coming. ## Advanced Interpretations ### Example 3: Sector Rotation Detection If you observe: - XLE (Energy) showing +2.10% while XLK (Technology) showing -1.50% - Both sectors' Week % values showing the opposite trend **Interpretation**: This suggests money is rotating out of technology into energy stocks. This rotation pattern is actionable - consider reducing tech exposure and increasing energy positions (look at XOM, CVX in the Top Stocks column). ### Example 4: RSI Divergences If you see XLU (Utilities) with: - Day % showing +0.50% (small positive) - RSI showing 72 (overbought, red background) **Interpretation**: Despite positive performance, the high RSI suggests the sector is overextended. This divergence between price and indicator suggests caution - the rally in utilities may be running out of steam. ### Example 5: Relative Strength in Weak Markets If SPY shows -1.20% but XLP (Consumer Staples) shows +0.30%: **Interpretation**: Consumer staples are showing defensive strength during market weakness. This is typical risk-off behavior. Consider defensive positions in stocks like PG, KO, or PEP for protection. ## Practical Application Scenarios ### Day Trading Setup 1. **Morning Market Assessment**: - Check which sectors are green pre-market - Focus on sectors with Day % > 1% and RSI between 40-70 - Identify 2-3 stocks from the Top Stocks column of the strongest sector 2. **Midday Reversal Hunting**: - Look for sectors with symbol color changing from red to green - Confirm with RSI moving away from extremes - Trade stocks from that sector showing similar pattern changes ### Swing Trading Application 1. **Trend Following**: - Identify sectors with positive Day % and Week % - Look for RSI values in uptrend but not overbought (45-65) - Enter positions in top stocks from these sectors, using daily charts for confirmation 2. **Contrarian Setups**: - Find sectors with deeply negative Day % but RSI < 30 - Look for divergence (price making new lows but RSI rising) - Consider counter-trend positions in the stronger stocks within these oversold sectors ## Reading Special Conditions ### Example 6: Risk-Off Environment If you observe: - XLP (Consumer Staples) and XLU (Utilities) both green - XLK (Technology) and XLY (Consumer Disc) both red - SPY slightly negative **Interpretation**: Classic risk-off rotation. Investors are moving to safety. Consider defensive positioning and reducing exposure to growth sectors. ### Example 7: Market Breadth Analysis Count the number of sectors in green vs. red: - If 7+ sectors are green: Strong bullish breadth, consider aggressive long positioning - If 7+ sectors are red: Weak market breadth, consider defensive positioning or shorts - If evenly split: Market is indecisive, focus on specific sector strength instead of broad market exposure Remember that this dashboard is most effective when combined with broader market analysis and appropriate risk management strategies.Pine Script® göstergesiyelober tarafındanGüncellendi 15
Rendon1 Swing Market Turns**Swing Market Turns Indicator** This indicator identifies potential swing highs and swing lows by integrating Relative Strength Index (RSI), volume confirmation, and higher timeframe (HTF) levels to accurately detect market reversals and turning points. Specifically optimized for swing traders, this tool aims to pinpoint moments when price momentum is shifting, providing clear signals for trade entries and exits. ### How It Works: - **RSI Divergence:** Detects momentum shifts through RSI overbought and oversold conditions. - **Higher Timeframe Levels:** Confirms reversals using support and resistance levels from higher timeframes. - **Volume Confirmation:** Ensures stronger validity of signals by checking if current volume exceeds the moving average of recent volume. ### Key Features: - Visual labels on chart clearly indicating potential swing highs and lows. - Customizable RSI period, RSI overbought/oversold thresholds, volume moving average length, and higher timeframe selections. - Built-in alert conditions for immediate notifications when swing opportunities are detected. ### Recommended Use: - Ideal for traders focusing on swing trading strategies, particularly those looking for high-probability turning points. - Effective across multiple assets including forex, stocks, commodities, and crypto. - Suitable for various intraday and higher timeframes, with customization options available. ### Settings: - **RSI Period:** Adjust the sensitivity of RSI calculation. - **Higher Timeframe:** Select the timeframe used for support/resistance reference. - **RSI Overbought/Oversold:** Customize thresholds defining extreme RSI values. - **Volume MA Length:** Specify the length for volume moving average calculation. Feel free to customize the parameters to best fit your trading style and asset of choice. **Disclaimer:** This indicator does not guarantee profitable trades and should be used in conjunction with proper risk management and additional analysis methods. Pine Script® göstergesiRendon1 tarafından51
Super RSI: Multi-Timeframe, Multi-RSI-MA, Multi Symbol [DucTri]█ Overview RSI is a very popular indicator that almost every trader knows about. I created this indicator with the goal of helping you use RSI more conveniently and effectively. █ Uses Monitor the RSI of 10 currency pairs simultaneously. The first column shows the RSI of the current currency pair. RSI below 30 will have a Red background, and above 70 will have a Green background. Display multiple RSI lines with different lengths (or timeframes). Displays 3 RSI with 3 different lengths 7, 14 and 21 Displays two RSI lines with two different timeframes. The purple line shows RSI (14) for the 1H timeframe, and the blue line shows RSI (14) for the 4H timeframe. Display MA and Bollinger Band lines for RSI. Shows the RSI line along with two MA lines of the RSI: EMA (9) in blue and WMA (45) in red. Identify RSI Divergence with custom settings █ Input - You can have up to three RSI lines, with customizable lengths and timeframes. - You also have up to three RSI-MA lines, where you can customize the MA type and length. - You can track RSI for up to 10 currency pairs at the same time. - Additionally, you can change how the top (or bottom) is determined when identifying divergence. █ Alerts Send alerts when two RSI lines cross. For example, when the RSI 14 crosses above the RSI 21, or the RSI on the 1H timeframe crosses above the RSI on the 4H timeframe.* Send alerts when RSI crosses above or below the RSI-MA line. Send alerts when two RSI-MA lines cross. For example, when the RSI-EMA (9) crosses above the RSI-WMA (45).* Send alerts when Divergence (Convergence) appears. Send alerts when any currency pair in the monitored list shows an Overbought or Oversold signal. Pine Script® göstergesiDucTri_dev tarafındanGüncellendi 44280
Jurik Smoothed Stochastic - TraderHalaiJurik Smoothed Stochastic The stochastic indicator has been long used by traders to identify inflection points in the price and to give a direction on Bullish and Bearish bias. This indicator aims to improve on the plots the %K value smoothed using a Jurik Filter instead of a simple moving average. This allows for a more adaptive K value average price, whilst also providing superior smoothing to traditional moving averages. As the Jurik Filter is a proprietary and non-open-source implementation, this script uses a common filters library implementation of Jurik MA which is a suitable proxy to the actual Jurik MA filter. Big thanks to LastGuru for making his version freely available. You can find his version of the Jurik Filters in the credits section below. %K is the Jurik Smoothed Version of the original Stochastic Formula %D is calculated using the following formula. This idea was borrowed from John Ehler’s stochastic implementation and can be seen below: %D = 0.05 + 0.95 * K Features %K line, Overbought and Oversold level and Mid Line Level Oversold / Overbought reversal indicators and signals - Shown in Red and Green Bullish / Bearish Divergences – Including Hidden divergences to spot reversals and continuations of trend (Big thanks to the developers of the built-in RSI Divergence indicator) - Shown as below: Bullish / Bearish crossover of %K with %D - Shown in Cyan and Fuschia Alerts for all of the above conditions Double Jurik smoothing mode - similar to slow Stochastic Credits : Massive shoutout to the following scripts: LastGuru JurikMA implementation (Common Filters Library) Divergence Indicator – Built into TradingView and coded by TradingView Developers This script is published as open source to allow for criticism, further development of this strategy and use by the community. Feel free to use this indicator/source code as you see fit. Enjoy! :) Pine Script® göstergesiTraderHalai tarafındanGüncellendi 22136
MFI Divergence Indicator Our Developer Malin converted the built-in RSI divergence indicator to MFI (Money Flow Index). How to apply? Notice 1: MFI, unlike the RSI, incorporates volume. It thus is an indicator of a higher precision when it comes to finding the the moment to sell - or - the moment to enter. Notice 2: In Ranging Markets MFI (and RSI) is a solid momentum indicator to buy or sell. The asset displayed shows a slight markdown. Thus, we are looking primarily for short positions. Once can tell by us omitting the first 2 hidden bearish divergence signals and then entering the market. Notice 3: Divergences depend on pivot points. The drawback with pivot points is that it is a lagging indication of a potential reversal. The more time (bars) one takes to confirm a reversal the less profitable is the trade - but less risky. In the charts one can tell that we enter the market 5 bars later. Usually that is not the tip of the reversal. Notice 4: One must adapt the left and right periods of the indicator to risk/reward ratio, length of swing / frequency modulation and volatility of the price action. Credits: Credits go to the Tradingview Team for delivering the original code. And Malin for the conversion. Please keep the copy right as a courtesy. Pine Script® göstergesisparkandhale tarafındanGüncellendi 88291
Divergence shortterm swing daytrading I've added a few lines to Mawreez' RSI Divergence Detector. I edited the visual and filtered the signals in same direction of the current candle. this indicator shows long and short signals based on divergences. It's better not to trade against powerful trend. Pine Script® göstergesisoroush68 tarafından77
Bhuvana Retrace Predictor (ATR + RSI Dive + St Break)It’s a “retracement warning + confirmation” tool. Nothing more. Concept in simple words Price runs too far too fast The script uses EMA + ATR bands to detect when price is “stretched” (far from normal). The run is losing power It checks RSI divergence: Price makes a new high but RSI doesn’t → buyers are getting weaker. Price makes a new low but RSI doesn’t → sellers are getting weaker. It waits for proof the pullback started It then waits for a small structure break: For a drop: price closes below a recent minor low. For a bounce: price closes above a recent minor high. What each label means SETUP = “Retracement is likely soon” (don’t chase). CONFIRM = “Retracement probably started” (now it’s tradable). Brutal truth This doesn’t predict perfectly. It just stacks 3 common signs: overextended + weakening momentum + structure break.Pine Script® göstergesimankarnan tarafından1121
Bhuvana Retrace Predictor It’s a “retracement warning + confirmation” tool. Nothing more. Concept in simple words Price runs too far too fast The script uses EMA + ATR bands to detect when price is “stretched” (far from normal). The run is losing power It checks RSI divergence: Price makes a new high but RSI doesn’t → buyers are getting weaker. Price makes a new low but RSI doesn’t → sellers are getting weaker. It waits for proof the pullback started It then waits for a small structure break: For a drop: price closes below a recent minor low. For a bounce: price closes above a recent minor high. What each label means SETUP = “Retracement is likely soon” (don’t chase). CONFIRM = “Retracement probably started” (now it’s tradable). Brutal truth This doesn’t predict perfectly. It just stacks 3 common signs: overextended + weakening momentum + structure break.Pine Script® göstergesimankarnan tarafından11
Rsi bar, divergences, tether line, ema 20,50 -Ema 20,50 -Tether Line dominance -Buy/sell pressure -Rsi last candle -byu sell signal -rsi divergence -macd divergence -Coloured candles 25,30 rsi and 70 rsi Pine Script® göstergesidvdsima tarafından1176
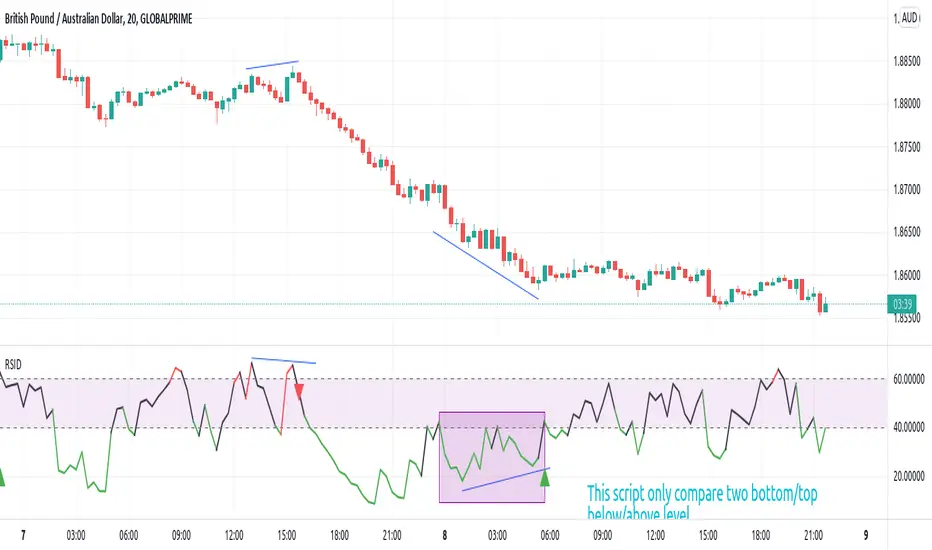
[JL] Relative Strength Index - Divergence AlertThis script displays rsi divergence alert. Only compare two bottom/top. Top: RSI decrease and high increase Bottom: RSI increase and low decrease. Warning: Please don't only use this signal to trade. Divergences are always early signals need to be confirmed.Pine Script® göstergesiJesse.Lau tarafından175
OBV with DivergenceAll I did was combine the logic from LazyBear for his OBV Oscillator to regular RSI divergence logic (where I replaced the RSI input to use LazyBear's OBV). I didn't use any original code! Neither OBV (written by LazyBear) nor DIvergence (author unknown) was written by me. I merely modified the sytax a little to combine them. Very useful for spotting divergences with OBV oscillator. Pine Script® göstergesivyperphi696 tarafından1616 1.3 K
Smart Money Structure | GainzAlgo📊 OVERVIEW: ================ Smart Money Structure Analysis is a professional-grade market structure and order-flow system designed to identify institutional trading behavior through volatility-adaptive logic, multi-timeframe trend alignment, and volume-based confirmation. This indicator implements original mathematical models to detect Change of Character (CHoCH), Break of Structure (BOS), cumulative volume dynamics, and trend convergence across seven timeframes — delivering high-probability trade signals with significantly reduced noise. Unlike basic indicator combinations, this system functions as a unified trading framework, where volatility adaptation, structure analysis, and volume confirmation continuously reinforce each other to provide precise, context-aware signals. ⭐ WHY THIS SYSTEM IS UNIQUE AND WORTHY OF PUBLICATION: ===================================================== This is not a collection of common indicators placed together. Smart Money Structure Analysis represents a cohesive institutional methodology, engineered so that: - Volatility adjusts signal sensitivity in real time - Multi-timeframe trends define directional bias - Market structure determines timing - Volume confirms institutional participation - Advanced filters eliminate low-quality setups Each component is mathematically linked to the others, creating a workflow that cannot be replicated by stacking separate indicators. 🔗 SYNERGISTIC INTEGRATION – HOW THE SYSTEM WORKS TOGETHER: ========================================================== 🧠 1. CONTEXT-AWARE VOLATILITY ADAPTATION ATR-based volatility logic dynamically adjusts all momentum thresholds: - Higher volatility → stronger confirmation required - Lower volatility → sensitivity increases to capture valid moves This prevents over-signaling in choppy markets and under-signaling during expansion phases — a core flaw in static indicators. 📐 2. MULTI-TIMEFRAME TREND CONVERGENCE ENGINE Seven timeframes are analyzed simultaneously: 1M • 5M • 15M • 30M • 1H • 4H • 1D Each timeframe is scored using EMA + VWAP alignment, producing a composite Trend Strength Score from -100 to +100. The stronger the alignment across timeframes, the higher the probability of continuation — instantly visible through the real-time dashboard. 🏗️ 3. INSTITUTIONAL MARKET STRUCTURE (CHoCH & BOS) The system automatically identifies the two core smart money concepts: - CHoCH (Change of Character): Signals potential trend exhaustion or reversal zones - BOS (Break of Structure): Confirms trend continuation and institutional commitment Structure zones are visualized with persistent, color-coded levels and clouds, providing precise contextual timing rather than lagging signals. 📊 4. CUMULATIVE VOLUME DELTA (CVD) CONFIRMATION CVD tracks the cumulative difference between buying and selling pressure: - Rising CVD → accumulation - Falling CVD → distribution - Divergence vs price → early reversal warning Volume participation is categorized into Low / Medium / High, adding depth beyond simple volume bars. 🛡️ 5. SIX-LAYER PROFESSIONAL SIGNAL FILTERING Every signal must pass through up to six independent confirmation layers: 1. Volatility-adjusted momentum 2. Higher timeframe trend alignment 3. Lower timeframe conflict prevention 4. Institutional volume confirmation 5. Structural breakout validation 6. Repeated-signal restriction This dramatically reduces false positives while preserving only high-quality institutional setups. 🧮 DETAILED CORE SYSTEMS: ======================== 📏 ADAPTIVE MOMENTUM FORMULA - Momentum Threshold = Base × (1 + (ATR ÷ Price) × 2) - Pre-Momentum Factor = Base × (1 − (ATR ÷ Price) × 0.5) 📊 TREND STRENGTH CALCULATION - Trend Strength = (Sum of 7 timeframe scores ÷ 7) × 100 📦 CVD LOGIC - Close > Previous Close → Buy volume added - Close < Previous Close → Sell volume subtracted - Cumulative sum reveals institutional intent 🧠 STRUCTURE DETECTION - Pivot-based swing logic - Candle confirmation - Configurable lookback periods - Non-repainting visualization 🧩 ADVANCED ANALYSIS TOOLS: ========================== 🧲 LIQUIDITY ZONE DETECTION Identifies probable retail stop-loss clusters where institutions often initiate stop hunts before true directional moves. 📦 MARKET PROFILE & ORDER FLOW IMBALANCE Detects buy/sell dominance using volume ratios, highlighting accumulation and distribution zones before large price moves. 🔄 RSI DIVERGENCE SCANNER Identifies bullish and bearish divergences that frequently precede structure shifts and trend reversals. 🎨 VISUAL SYSTEM & DASHBOARD: ============================ 📊 SMART MONEY MATRIX - Composite trend strength - System confidence % - CVD value - Directional grid for all timeframes 📈 TREND PREDICTION MATRIX (Optional) Forecasts short-term directional bias using trend, momentum, and volatility data. 🏷️ SIGNAL LABELS - BUY / SELL → Fully confirmed entries - READY → Momentum building - BOS / CHoCH → Structure events - FLOW / LIQ / BULL / BEAR → Advanced confirmations ⚙️ CORE FEATURES: ================ 1. Multi-Timeframe Trend Convergence 2. Smart Money Structure Detection (CHoCH & BOS) 3. Adaptive Volatility-Based Momentum 4. Cumulative Volume Delta (CVD) 5. Six-Layer Signal Filtering 6. Liquidity Zone Detection 7. Order Flow & Market Profile Analysis 8. Divergence Scanner 9. Dynamic Trendlines 10. Institutional-Grade Dashboard 📘 WHO THIS INDICATOR IS FOR: ============================ - Scalpers: Noise-filtered precision on lower timeframes - Day Traders: High-probability continuation setups - Swing Traders: Multi-timeframe alignment & structure zones - Reversal Traders: Divergence + CHoCH confirmation ⚠️ IMPORTANT DISCLAIMER: ======================== This indicator is a technical analysis and educational tool only. It does not provide financial advice or trade recommendations. Trading involves substantial risk, and losses are a natural part of trading. Past performance does not guarantee future results. All trading decisions remain the sole responsibility of the user.Pine Script® göstergesiGainzAlgo tarafından5858 5.7 K
Dresteghamat-Multi timeframe Regime & Exhaustion**Dresteghamat-Multi timeframe Regime & Exhaustion** This script is a custom decision-support dashboard that aggregates volatility, momentum, and structural data across multiple timeframes to filter market noise. It addresses the problem of "Analysis Paralysis" by automating the correlation between lower timeframe momentum and higher timeframe structure using a weighted scoring algorithm. ### 🔧 Methodology & Calculation Logic The core engine does not simply overlay indicators; it normalizes their outputs into a unified score (-100 to +100). The logic is hidden (Protected) to preserve the proprietary weighting algorithm, but the underlying concepts are as follows: **1. Adaptive Timeframe Selection (Context Engine)** Instead of static monitoring, the script detects the user's current chart timeframe (`timeframe.multiplier`) and dynamically assigns two relevant Higher Timeframes (HTF) as anchors. * *Logic:* If Current TF < 5min, the script analyzes 15m and 1H data. If Current TF < 1H, it shifts to 4H and Daily data. This ensures the analysis is contextually relevant. **2. Regime & Volatility Filter (ATR Based)** We use the Average True Range (ATR) to determine the market regime (Trend vs. Range). * **Calculation:** We compare the current Swing Range (High-Low lookback) against a smoothed ATR. A high Ratio (> 2.0) indicates a Trend Regime, activating Trend-Following logic. A low ratio dampens the signals. **3. Directional Bias (Structure + Flow)** Direction is not determined by a single crossover. It is a fusion of: * **Swing Structure:** Using `ta.pivothigh/low` to identify Higher Highs/Lower Lows. * **Volume Flow:** Calculating the cumulative delta of candle bodies over a lookback period. * **Micro-Bias:** A short-term (default 5-bar) momentum filter to detect immediate order flow changes. **4. Exhaustion Logic (Mean Reversion Warning)** To prevent buying at tops, the script calculates an "Exhaustion Score" based on: * **RSI Divergence:** Detecting discrepancies between price peaks and momentum. * **Volatility Extension:** Identifying when price has deviated significantly from its volatility mean (VRSD logic). * **Volume Anomalies:** Detecting low volume on new highs (Supply absorption). ### 📊 How to Read the Dashboard The table displays the raw status of each timeframe. The **"MODE"** row is the output of the algorithmic decision tree: * **BUY/SELL ONLY:** Generated when the Current TF momentum aligns with the dynamically selected HTF structure AND the Exhaustion Score is below the threshold (default 70). * **PULLBACK:** Triggered when the HTF Structure is bullish, but Current Momentum is bearish (indicating a corrective phase). * **HTF EXHAUST:** A safety warning triggered when the HTF Volatility or RSI metrics hit extreme levels, overriding any entry signals. * **WAIT:** Default state when volatility is low (Range Regime) or signals conflict. ### ⚠️ Disclaimer This tool provides algorithmic analysis based on historical price action and volatility metrics. It does not guarantee future results.Pine Script® göstergesidr-esteghamat tarafından1125
Momentum Matrix (BTC-COIN)The Momentum Matrix (BTC-COIN) indicator analyzes the momentum relationship between Coinbase stock ( NASDAQ:COIN ) and Bitcoin ( CRYPTOCAP:BTC ). By combining RSI, correlation, and dominance metrics, it identifies bullish and bearish macro trends to align trades with market momentum. How It Works Price Inputs: Pulls weekly price data for CRYPTOCAP:BTC and NASDAQ:COIN for macro analysis. Metrics Calculated: • RSI Divergence: Measures momentum differences between CRYPTOCAP:BTC and $COIN. • Price Ratio: Tracks the $COIN/ CRYPTOCAP:BTC relationship relative to its long-term average (SMA). • Correlation: Analyzes price co-movement between CRYPTOCAP:BTC and $COIN. • Dominance Impact: Incorporates CRYPTOCAP:BTC dominance for broader crypto trends. Composite Momentum Score: Combines these metrics into a smoothed macro momentum value. Thresholds for Trend Detection: Upper and lower thresholds dynamically adapt to market conditions. Signals and Visualization: • Buy Signal: Momentum exceeds the upper threshold, indicating bullish trends. • Sell Signal: Momentum falls below the lower threshold, indicating bearish trends. • Background Colors: Green (bullish), Red (bearish). Strengths Integrates multiple metrics for robust macro analysis. Dynamic thresholds adapt to market conditions. Effective for identifying macro momentum shifts. Limitations Lag in high volatility due to smoothing. Less effective in choppy, sideways markets. Assumes CRYPTOCAP:BTC dominance drives NASDAQ:COIN momentum, which may not always hold true. Improvements Multi-Timeframe Analysis: Add daily or monthly data for precision. Volume Filters: Include volume thresholds for signal validation. Additional Metrics: Consider MACD or Stochastics for further confirmation. Complementary Tools Volume Indicators: OBV or cumulative delta for confirmation. Trend-Following Systems: Pair with moving averages for timing. Market Breadth Metrics: Combine with CRYPTOCAP:BTC dominance trends for context. Pine Script® göstergesiSHA256orBUST tarafından67
RSI Screener / Heatmap - By LeviathanThis script allows you to quickly scan the market by displaying the RSI values of up to 280 tickers at once and visualizing them in an easy-to-understand format using labels with heatmap coloring. 📊 Source The script can display the RSI from a custom timeframe (MTF) and custom length for the following data: - Price - OBV (On Balance Volume) - Open Interest (for crypto tickers) 📋 Ticker Selection This script uses a different approach for selecting tickers. Instead of inputting them one by one via input.symbol(), you can now copy-paste or edit a list of tickers in the text area window. This approach allows users to easily exchange ticker lists between each other and, for example, create multiple lists of tickers by sector, market cap, etc., and easily input them into the script. Full credit to @allanster for his functions for extracting tickers from the text. Users can switch between 7 groups of 40 tickers each, totaling 280 tickers. 🖥️ Display Types - Screener with Labels: Each ticker has its own color-coded label located at its RSI value. - Group Average RSI: A standard RSI plot that displays the average RSI of all tickers in the group. - RSI Heatmap (coming soon): Color-coded rows displaying current and historical values of tickers. - RSI Divergence Heatmap (coming soon): Color-coded rows displaying current and historical regular/hidden bullish/bearish divergences for tickers. 🎨 Appearance Appearance is fully customizable via user inputs, allowing you to change heatmap/gradient colors, zone coloring, and more. Pine Script® göstergesiLeviathanCapital tarafından2020 2.2 K
Trend Reversal Engine (CHoCH + EMA + RSI)This professional-grade indicator is not just a collection of signals; it is a complete algorithmic trading system designed to solve the most common problem in retail trading: The Fake-Out. By combining Institutional Market Structure (SMC) with High-Frequency Momentum Filters, the Pine Reversal Engine V6 provides a high-conviction "Confluence Engine" that filters out noise and identifies high-probability turning points. The Three Pillars of Execution 1. The Institutional Foundation: Market Structure (CHoCH + HL) Most traders lose money because they trade against the trend. This engine identifies the Change of Character (CHoCH)—the exact moment a downtrend breaks and the first institutional "buy-side" liquidity is injected. It doesn't stop there; it requires a Higher Low (HL) confirmation, ensuring you aren't catching a falling knife, but riding a confirmed structural shift. 2. The Momentum Shield: Dual EMA & RSI Engine We use a 9-period and 21-period EMA combo as a dynamic filter. The system only permits "Long Entry" labels when the 9 EMA is trending above the 21, acting as a trend-strength validator. Furthermore, it integrates a Bullish RSI Divergence engine. This is the "secret sauce"—it detects when price makes a lower low while momentum (RSI) makes a higher low, signaling that sellers are exhausted and a massive reversal is imminent. 3. The Precision Trigger: Confluence Confirmation A signal is only generated when all "stars align." This includes: Historical Support Validation: Price must be sitting on a major pivot zone. The Retest Logic: High-probability entries occur when price "kisses" the 9 EMA from above during a bullish trend. Candlestick Psychology: The final "Go" signal requires a Bullish Engulfing or Pin-bar pattern, proving that buyers have physically seized control of the price action at that specific second. Why Professionals Choose This Engine Zero-Guesswork Dashboard: A real-time overlay table that summarizes Trend, Structure, and Divergence. You see exactly why a trade is valid at a single glance. Pine V6 Architecture: Built on the bleeding edge of TradingView’s newest language version. It is faster, more efficient, and future-proof. Visual Clarity: Beautifully rendered labels and background highlights (EMA Retest zones) turn your chart into a professional workstation, reducing cognitive load and trading fatigue. Risk-Focused: By requiring price to be at historical support levels, it naturally forces you into trades with tight stop-loss potential and massive Reward-to-Risk ratios. Stop trading lagging indicators. Start trading the confluence of Structure, Momentum, and Price ActionPine Script® göstergesimueleezytrade tarafındanGüncellendi 9
9:45am NIFTY TRADINGTime Frame: 15 Minutes | Reference Candle Time: 9:45 AM IST | Valid Trading Window: 3 Hours 📌 Introduction This document outlines a structured trading strategy for NIFTY & BANKNIFTY Options based on a 15-minute timeframe with a 9:45 AM IST reference candle. The strategy incorporates technical indicators, probability analysis, and strict trading rules to optimize entries and exits. 📊 Core Features 1. Reference Time Trading System 9:45 AM IST Candle acts as the reference for the day. All signals (Buy/Sell/Reversal) are generated based on price action relative to this candle. The valid trading window is 3 hours after the reference candle. 2. Signal Generation Logic Signal Condition Buy (B) Price breaks above reference candle high with confirmation Sell (S) Price breaks below reference candle low with confirmation Reversal (R) Early trend reversal signal (requires strict confirmation) 3. Probability Analysis System The strategy calculates Win Probability (%) using 4 components: Component Weight Calculation Body Win Probability 30% Based on candle body strength (body % of total range) Volume Win Probability 30% Current volume vs. average volume strength Trend Win Probability 40% EMA crossover + RSI momentum alignment Composite Probability - Weighted average of all 3 components Probability Color Coding: 🟢 Green (High Probability): ≥70% 🟠 Orange (Medium Probability): 50-69% 🔴 Red (Low Probability): <50% 4. Timeframe Enforcement Strictly 15-minute charts only (no other timeframes allowed). System auto-disables signals if the wrong timeframe is selected. 📈 Technical Analysis Components 1. EMA System (Trend Analysis) Short EMA (9) – Fast trend indicator Middle EMA (20) – Intermediate trend Long EMA (50) – Long-term trend confirmation Rules: Buy Signal: Price > 9 EMA > 20 EMA > 50 EMA (Bullish trend) Sell Signal: Price < 9 EMA < 20 EMA < 50 EMA (Bearish trend) 2. Multi-Timeframe RSI (Momentum) 5M, 15M, 1H, 4H, Daily RSI values are compared for divergence/confluence. Overbought (≥70) / Oversold (≤30) conditions help in reversal signals. 3. Volume Analysis Volume Strength (%) = (Current Volume / Avg. Volume) × 100 Strong Volume (>120% Avg.) confirms breakout/breakdown. 4. Body Percentage (Candle Strength) Body % = (Close - Open) / (High - Low) × 100 Strong Bullish Candle: Body > 60% Strong Bearish Candle: Body < 40% 📊 Visual Elements 1. Information Tables Reference Data Table (9:45 AM Candle High/Low/Close) RSI Values Table (5M, 15M, 1H, 4H, Daily) Signal Legend (Buy/Sell/Reversal indicators) 2. Chart Overlays Reference Lines (9:45 AM High & Low) EMA Lines (9, 20, 50) Signal Labels (B, S, R) 3. Color Coding High Probability (Green) Medium Probability (Orange) Low Probability (Red) ⚠️ Important Usage Guidelines ✅ Best Practices: Trade only within the 3-hour window (9:45 AM - 12:45 PM IST). Wait for confirmation (closing above/below reference candle). Use probability score to filter high-confidence trades. ❌ Avoid: Trading outside the 15-minute timeframe. Ignoring volume & RSI divergence. Overtrading – Stick to 1-2 high-probability setups per day. 🎯 Conclusion This NIFTY Trading Strategy is optimized for 15-minute charts with a 9:45 AM IST reference candle. It combines EMA trends, RSI momentum, volume analysis, and probability scoring to generate high-confidence signals. 🚀 Key Takeaways: ✔ Reference candle defines the day’s bias. ✔ Probability system filters best trades. ✔ Strict 15M timeframe ensures consistency. Happy Trading! 📈💰Pine Script® göstergesilinupro tarafından66218
Relative Strength Index - Divergences, Stoch, Reverse StochThis is aggregation of RSI indicators - RSI, Divergences, Reverse & Stochastic RSI Thanks to ©JayTradingCharts and ©mohanee for the RSI Divergences code Thanks to BApig - Motgench, balipour and Wugamlo for the reverse stoch code Changes: 1. Add option to calc divs based on close or wicks or both (RSI is close based) 2. Add pivots (marking local high/low) 3. Update to Pine v5 4. Cleanup of unused codePine Script® göstergesiCryptoTechGuy1 tarafındanGüncellendi 77128